
Forex Trends Explained: Uptrend, Downtrend & Sideways
What Is a Trend in Forex?
In forex trading, a trend simply describes the general direction in which a currency pair’s price is moving over a period of time. Prices rarely move in a straight line — they zigzag with small pullbacks and pushes — but when you zoom out, a clear pattern usually emerges. Recognizing that pattern early is what allows traders to align their strategy with the market instead of guessing at every candle.
Uptrend Definition: What Does an Uptrend Look Like?
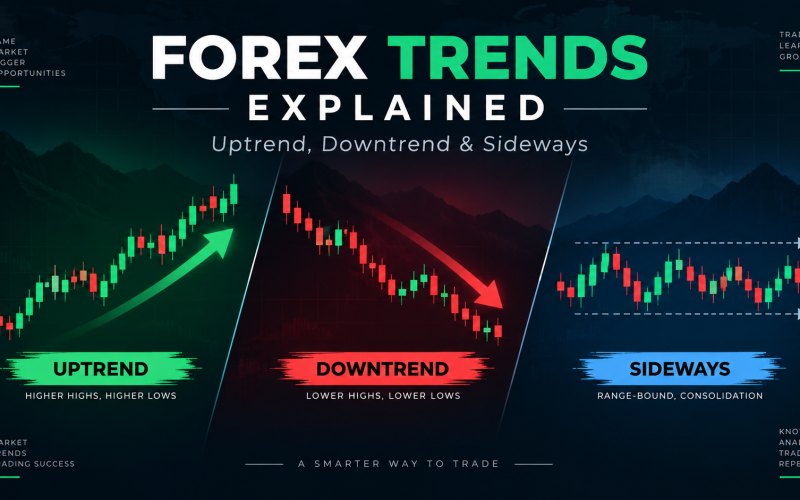
The uptrend definition is straightforward: it is a market condition where price consistently makes higher highs and higher swings over time. Each rally pushes above the previous peak, and each pullback stays above the previous low. This pattern signals that buyers are in control and demand for the currency is outweighing supply.
Traders often confirm an uptrend using moving averages, where price stays above a rising average line, or by simply connecting the swing lows with a rising trend line. As long as that structure of higher highs and higher lows holds, the uptrend is considered intact.
Downtrend Meaning: How to Spot a Falling Market
The downtrend meaning is the mirror image of an uptrend. Here, price forms a sequence of lower highs and lower lows, showing that sellers are firmly in control and supply is outweighing demand. Each bounce fails to reach the previous high, and each decline pushes deeper than the last.
A falling trend line drawn across the swing highs, along with price trading below a declining moving average, are common ways traders confirm that a downtrend is genuinely in place rather than just a temporary dip.
Sideways Trend: When the Market Takes a Pause
Not every market is trending. A sideways trend, also called a ranging or consolidating market, occurs when price moves between a relatively steady support level and resistance level without making meaningful progress in either direction. This often happens when buyers and sellers are in near balance, or when the market is waiting for a new catalyst before committing to a direction.
Sideways markets require a different approach than trending markets — strategies built for trend-following often underperform here, while range-based strategies tend to work better.
Trend Line: Your Simplest Charting Tool
A trend line is one of the most basic yet powerful tools for visualizing market direction. In an uptrend, it is drawn by connecting a series of rising swing lows. In a downtrend, it connects a series of falling swing highs. The resulting line acts as a rough guide for dynamic support or resistance.
When price respects a trend line by bouncing off it repeatedly, it reinforces confidence in the current trend. When price breaks through a trend line with strong momentum, it is often one of the earliest visual warnings that a trend reversal may be approaching.
Trend Reversal: Recognizing When the Market Changes Direction
A trend reversal happens when the prevailing direction of the market shifts — an uptrend turns into a downtrend, or a downtrend turns into an uptrend. Reversals rarely happen instantly; they usually unfold through warning signs such as a broken trend line, a failure to make a new higher high or lower low, weakening momentum indicators, or the formation of reversal chart patterns like double tops, double bottoms, or head-and-shoulders formations.
Because reversals can be costly if missed, many traders combine multiple signals — trend line breaks, momentum divergence, and key support or resistance levels — before concluding that a genuine reversal, rather than a temporary pullback, is underway.
Follow the Trend: Why It Remains a Core Trading Principle
The phrase “follow the trend” reflects one of the oldest and most repeated principles in trading: it is generally easier and statistically safer to trade in the direction of the dominant trend than to try to predict when it will end. In an uptrend, this means favoring buy positions on pullbacks. In a downtrend, it means favoring sell positions on bounces.
This does not mean ignoring risk management or blindly holding positions. Rather, it means using tools like trend lines, moving averages, and momentum indicators to stay aligned with the broader market direction while still watching closely for the early signs of a trend reversal.
Final Thoughts
Mastering the basics of market direction — the uptrend definition, the downtrend meaning, the role of a trend line, the warning signs of a trend reversal, and the discipline to follow the trend — gives traders a solid framework for approaching the forex market with more clarity and less guesswork. Trends won’t tell you everything, but they remain one of the most reliable starting points for building a sound trading strategy.
