2mins read

Support and resistance are the backbone of technical analysis in forex trading. Every professional trader — whether they use price action, indicators, or algorithmic strategies — builds their framework around these two fundamental concepts. Yet for many beginners, identifying them accurately remains elusive. This guide defines every key concept you need: support level definition, resistance level, what happens when price breaks support, how to read a resistance test, and how to use pivot points as pre-calculated dynamic levels. Each section is paired with a real chart example so you can see the theory in action.
1. Support Level Definition
What Is a Support Level?
A support level is a specific price zone where buying interest is strong enough to halt a downward price move and push the market back up. It acts as a 'floor' beneath the price. Support forms because buyers — often large institutions — place buy orders at that price, creating demand that absorbs selling pressure.
Support levels are not always single precise prices. They are zones — areas where price consistently finds buyers. The wider and more frequently tested a zone, the more significant it becomes.

Figure 1: EUR/USD H4 — Price tests the 1.0800 support level four times, bouncing higher each time.
How to Identify Support Levels
Look for previous swing lows where price bounced significantly.
The more times price has tested and respected a level, the stronger the support.
Support zones should be identified on higher timeframes (H4, Daily) first, then refined on lower ones.
Round numbers (e.g., 1.0800, 1.1000) often act as psychological support due to large order clusters.
Volume spikes at a level confirm strong buyer interest and strengthen the support designation.
Trading the Support Level
Scenario | What It Means |
Price approaches support | Watch for confirmation — don't enter blind on first touch. |
Bullish candle forms at support | Entry signal: pin bar, engulfing candle, or inside bar. |
Stop-loss placement | Just below the support zone (10–15 pips below the swing low). |
Target (take-profit) | Next resistance level above — minimum 1:2 R:R ratio. |
Volume surge at support | Confirms accumulation by institutional buyers. |
⚠️ Key Rule Never enter a trade purely because price is at support. Wait for a price action confirmation signal. Support is a map — it tells you where to look, not what to do blindly. |
2. Resistance Level
What Is a Resistance Level?
A resistance level is the mirror image of support. It is a price zone where selling pressure consistently prevents the market from advancing further, acting as a 'ceiling'. At resistance, sellers — again, often large institutions — place sell orders that absorb buying pressure and push price back down.
Like support, resistance is best understood as a zone rather than an exact line. Price may spike slightly above a resistance level before reversing — these 'false breakouts' are a hallmark of institutional order flow at resistance.
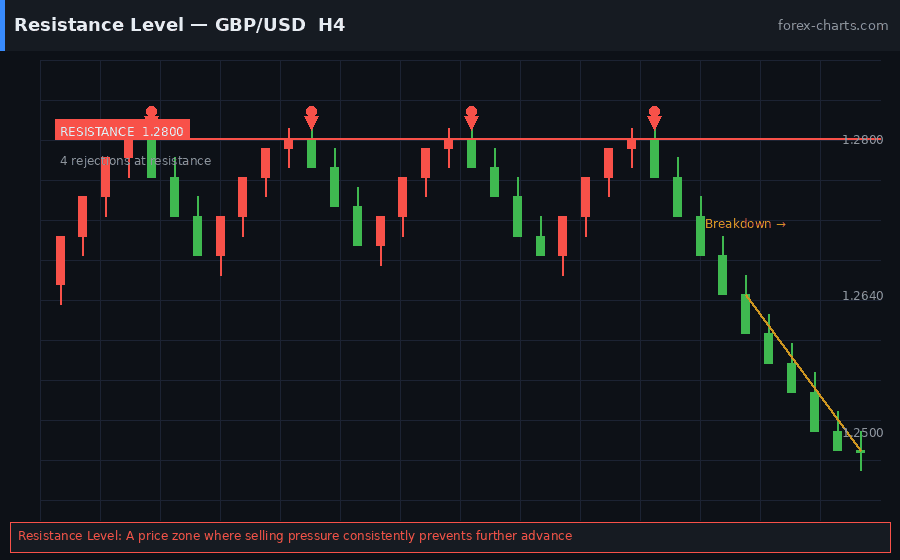
Figure 2: GBP/USD H4 — Price tests 1.2800 resistance four times and eventually breaks down.
How to Identify Resistance Levels
Find previous swing highs where price reversed significantly.
Multiple rejections at the same price zone = strong resistance.
Look for long upper wicks on candles — they indicate sellers overpowered buyers at that level.
Resistance from higher timeframes (weekly, daily) carries more weight.
Prior support that was broken often becomes future resistance (support-resistance flip).
Resistance Trading Strategies
Short entry: sell on rejection candle at resistance with stop above the zone.
Long setup: wait for a clean breakout and retest of the resistance level turning into support.
Avoid buying into resistance — this is where amateur traders get trapped.
Combine with RSI or MACD divergence for higher-probability short setups.
💡 Pro Insight Old resistance becomes new support after a breakout — and vice versa. This principle, known as the support-resistance flip, is one of the most powerful concepts in technical analysis. |
3. Breaking Support
What Does Breaking Support Mean?
Breaking support (also called a support breakdown) occurs when price closes decisively below a support level. This is a significant bearish signal. It tells traders that the buyers who were defending that level have been overwhelmed by sellers — and the balance of power has shifted.
When support breaks, two things typically follow. First, a sharp move lower as stop-losses from long traders get triggered, accelerating the sell-off. Second, a retest of the broken support level, which now acts as resistance.
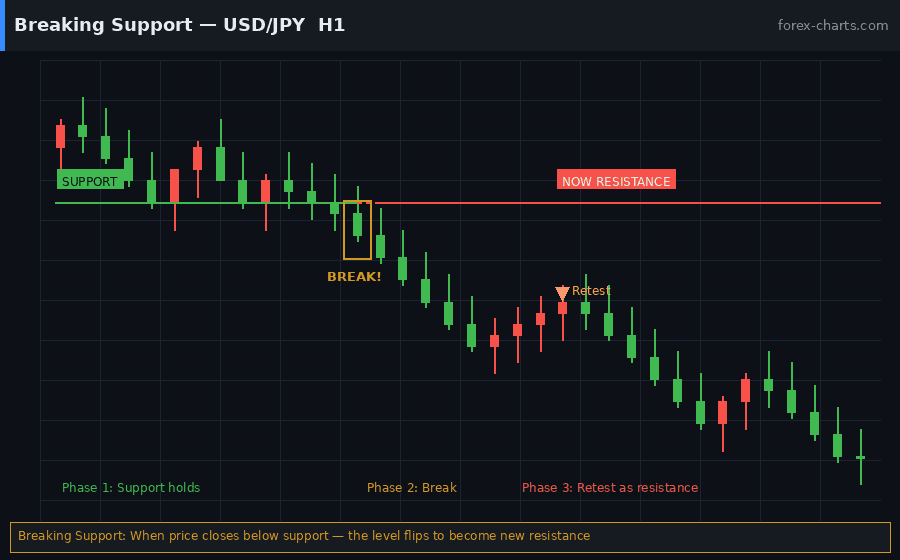
Figure 3: USD/JPY H1 — Support at 148.00 breaks, price retests it as resistance, then continues lower.
How to Confirm a Support Break
Candle closes below support — not just wicks. Body close below the level is required.
The breakdown candle shows above-average volume, confirming genuine selling pressure.
Retest of broken support as resistance provides a lower-risk short entry opportunity.
Multiple candle closes below support (not just one) increase conviction.
Avoid acting on initial spike below — wait for confirmation to filter false breakouts.
How to Trade a Support Break
Scenario | What It Means |
Entry option 1 — Aggressive | Short immediately on the close of the breakdown candle. |
Entry option 2 — Conservative | Wait for price to retest broken support (now resistance) and short on rejection. |
Stop-loss placement | Above the broken support level / retest high. |
Target | Next significant support level below (check daily/weekly chart). |
False breakdown risk | If price closes back above broken support, exit — the break failed. |
⚠️ False Breakouts Not every support break is real. 'Fakeouts' occur when price briefly dips below support before snapping back up. Wait for a candle close, then a retest, to reduce false signals significantly. |
4. Testing Resistance
What Is a Resistance Test?
Testing resistance refers to price approaching a resistance level and probing it — usually multiple times — without yet breaking through. Each test is a battle between buyers trying to push higher and sellers defending the ceiling. Understanding how price behaves during these tests is crucial for predicting whether a breakout or reversal will follow.
The quality of each test matters. A weak test (small-bodied candle, low volume) suggests neither side has conviction. A strong test (large bearish candle, high volume rejection) suggests sellers are in control. Conversely, tightening ranges on each test (price holding closer to resistance) suggests buyer momentum is building toward a breakout.
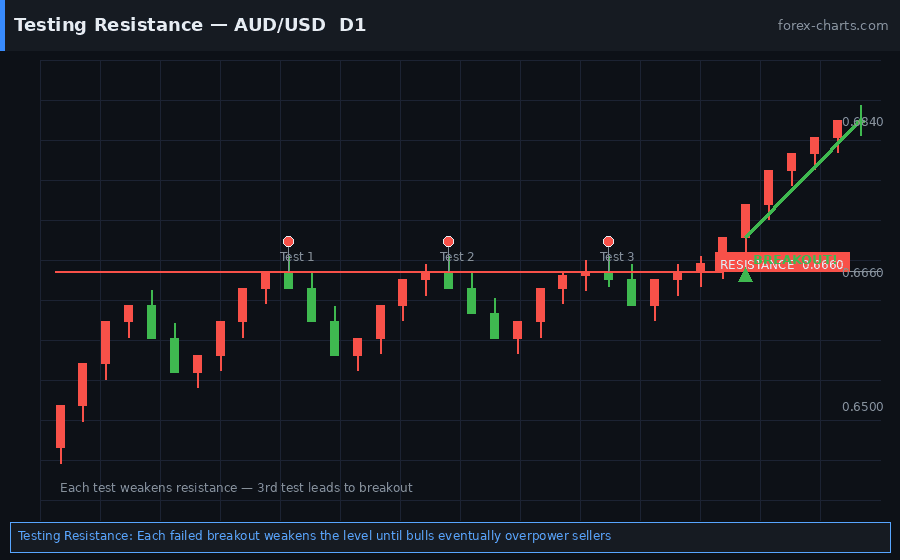
Figure 4: AUD/USD D1 — Three tests of 0.6660 resistance, each progressively tighter, followed by a bullish breakout.
Reading Resistance Tests
First test: Strong rejection likely — fresh resistance with full seller orders still in place.
Second test: Moderate rejection — some seller orders absorbed, but level still holds.
Third test: Often the weakest — most sell orders absorbed, buyers gaining control.
Shrinking candle bodies near resistance = tightening range = potential breakout building.
High-volume test with no significant rejection = buyers are overwhelming sellers.
Breakout Entry Strategy After Multiple Tests
Buy the candle that closes above resistance with a full body candle close above the zone.
Set stop-loss below the last swing low before the breakout.
Target: measure the height of the base pattern below resistance and project it upward.
A retest of the broken resistance as new support is a second, lower-risk entry point.
💡 The 3-Test Rule Three clean tests of a resistance level often precede a breakout. Each test depletes the available sell orders at that level. By the third test, institutional buyers frequently have enough momentum to push through. |
5. Pivot Points
What Are Pivot Points?
Pivot points are mathematically calculated support and resistance levels based on the previous session's high, low, and closing price. They are automatically plotted levels — no subjective drawing required — making them one of the most objective tools in a trader's arsenal.
Originally developed by floor traders to quickly assess intraday market direction, pivot points remain heavily used today because institutional participants, algorithmic systems, and professional traders worldwide reference the same levels simultaneously. This self-fulfilling nature makes them consistently reliable.
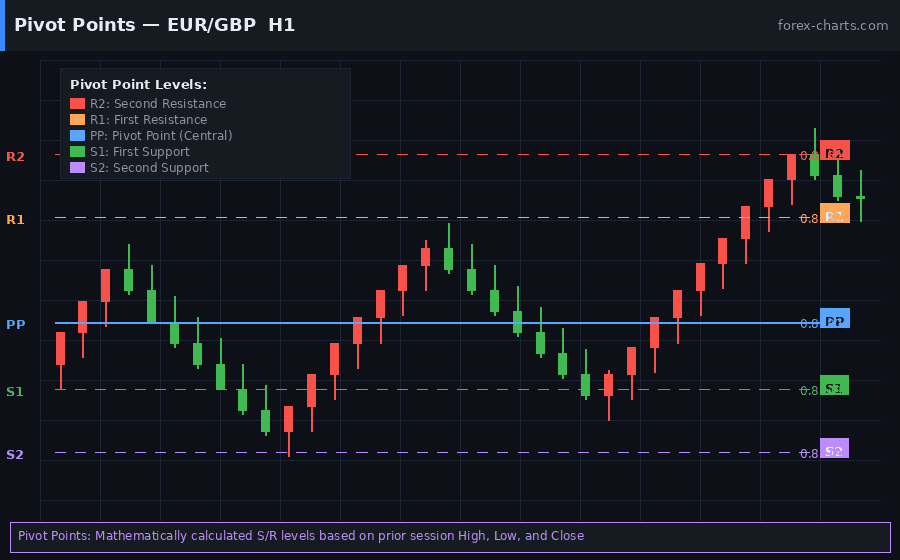
Figure 5: EUR/GBP H1 — Daily pivot points (PP, R1, R2, S1, S2) plotted, showing price respecting each level.
Pivot Point Formulas
Level | Formula | Role |
PP (Pivot Point) |
| Central benchmark — above is bullish, below bearish |
R1 (Resistance 1) |
| First overhead target / resistance |
R2 (Resistance 2) |
| Second overhead target / stronger resistance |
S1 (Support 1) |
| First downside support |
S2 (Support 2) |
| Second downside support / stronger floor |
How to Use Pivot Points in Trading
If price opens and trades above PP: bullish bias — target R1, then R2.
If price opens and trades below PP: bearish bias — target S1, then S2.
R1 and S1 are the most commonly tested levels each session — ideal for scalping.
R2 and S2 are high-conviction reversal zones when reached in a single session.
Combine pivot levels with candlestick patterns for high-probability setups.
When price breaks through R1, it often consolidates before attempting R2 — use this for entries.
Types of Pivot Points
Scenario | What It Means |
Standard / Classic | Most widely used. Based on previous day's H/L/C. Best for intraday. |
Fibonacci Pivot Points | Incorporates Fibonacci ratios. Popular with price action traders. |
Camarilla Pivot Points | 8 levels (4 above, 4 below). Used for range-bound sessions. |
Weekly Pivot Points | Based on previous week's data. Best for swing traders. |
Monthly Pivot Points | Long-term levels used by position traders and fund managers. |
💡 Pivot + S/R Confluence When a pivot point level aligns with a manually identified support or resistance level on your chart, the combined zone is significantly stronger. This confluence is one of the highest-probability trade setups in forex. |
Key Takeaways
Support level definition: A price zone where buying pressure prevents further decline.
Resistance level: A price zone where selling pressure prevents further advance.
Breaking support is a major bearish signal — broken support becomes new resistance.
Testing resistance multiple times depletes sell orders and often precedes a breakout.
Pivot points provide objective, pre-calculated S/R levels used by institutions worldwide.
S/R zones are stronger when confirmed by volume, multiple timeframes, and multiple tests.
Always trade with the direction of the higher timeframe trend when near S/R levels.
Wait for confirmation candles before entering trades at support or resistance — never anticipate


