
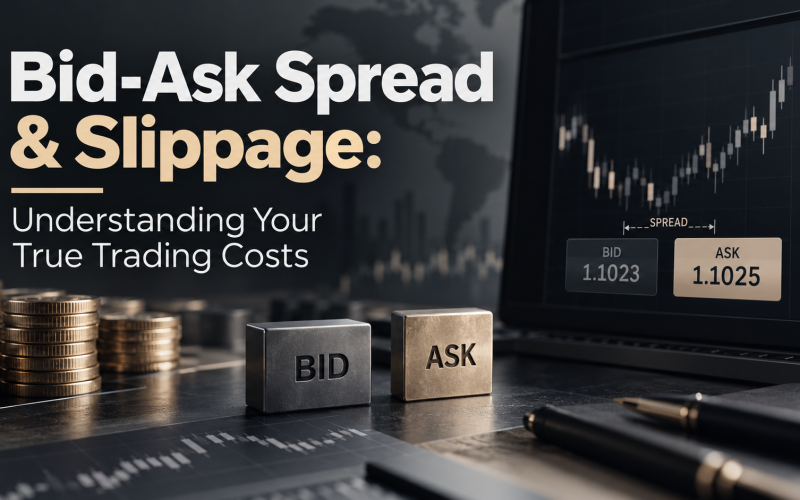
Bid-Ask Spread & Slippage: Understanding Your True Trading Costs
📌 The Hidden Cost Nobody Talks About
You enter a trade, win 20 pips, but after accounting for spread and slippage… you only profit 5 pips. Or worse: the spread + slippage eats your entire profit. This happens to 90% of retail traders because they DON’T UNDERSTAND SPREADS & SLIPPAGE. This guide reveals: what spreads are, how slippage works, the TRUE cost of every trade, how to minimize costs, and why spread differences can mean $1,000s lost per year. By the end, you’ll calculate true profitability and choose brokers wisely.
What is a Bid-Ask Spread? The Foundation
Bid-Ask Spread Definition:
The difference between the BID price (you sell) and ASK price (you buy). The spread is the broker’s profit and your cost to enter/exit trades.
Visual Example:
EUR/USD Quote: 1.0900 / 1.0905 BID = 1.0900 ← Broker buys at this price (you SELL) ASK = 1.0905 ← Broker sells at this price (you BUY) SPREAD = 1.0905 – 1.0900 = 0.0005 = 5 PIPS
How It Works:
- You want to BUY EUR/USD: You buy at ASK price = 1.0905
- Price moves up to 1.0920: You profit 15 pips… BUT
- You want to SELL EUR/USD: You sell at BID price = 1.0915
- Your TRUE profit: 1.0915 – 1.0905 = 10 pips (NOT 15!)
- Spread cost on exit: 5 pips (the spread again!)
Total spread cost = 10 pips (5 pips on entry + 5 pips on exit)
The Spread Calculation:
Total Spread Cost = Spread Size × 2 (entry + exit)
1.0 pip spread = 2 pips total cost
5 pip spread = 10 pips total cost
3 pip spread = 6 pips total cost
💚 Key Insight: Every trade costs you the SPREAD × 2. On 1 standard lot (100,000 units), a 1 pip spread = $10 cost. A 5 pip spread = $50 cost. This is why tight spreads matter!
Types of Spreads: Fixed vs Floating
Fixed Spreads:
- What it is: Spread stays the same = always 1.6 pips, always 3.0 pips
- Advantage: Predictable cost. Easy to calculate PnL
- Disadvantage: Wide spreads during low liquidity (news, gap opens)
- Best for: Beginners who want predictability
Example: Olympus Standard Account = 1.6 pips fixed
EUR/USD always 1.6 pips, GBP/USD always 1.6 pips
Total cost per round trip = 3.2 pips
Floating (Variable) Spreads:
- What it is: Spread changes = 0.1 pips during liquid hours, 2-5 pips during news
- Advantage: Tightest spreads during normal hours (0.0-0.5 pips)
- Disadvantage: Widens dramatically during volatility, news events, low liquidity
- Best for: Scalpers, day traders (fast execution needed)
Example: Olympus Raw/Pro Accounts = 0.0 pips floating
EUR/USD = 0.1 pips (normal market), but can spike to 5+ pips (high volatility)
GBP/USD = 0.2 pips (normal), 10+ pips (news events)
Comparison Table:
| Spread Type | Normal Market | High Volatility | Round Trip Cost | Best For |
|---|---|---|---|---|
| Fixed 1.6 | 1.6 pips | 1.6 pips | 3.2 pips | Beginners, predictability |
| Floating 0.0 | 0.1-0.3 pips | 5-15+ pips | 0.2-30+ pips | Scalpers, speed traders |
| ECN/STP | 0.0-0.5 pips | 2-8 pips | 0-1+ pips | Institutional, low cost |
❌ The Fixed Spread Trap: “1.6 pips fixed is cheap!” NO. Floating 0.0 pips gives 0.1 pips during normal hours = 20x tighter! Fixed spreads hide costs.
What is Slippage? The Invisible Cost
Slippage Definition:
The difference between the price you REQUESTED and the price you ACTUALLY GOT. Slippage occurs when price moves between when you click “Buy/Sell” and when the broker executes.
Real Example:
Scenario: You place a BUY order
You see: EUR/USD = 1.0900 / 1.0905
You click BUY at ASK = 1.0905
By the time broker executes (50ms later):
Price has moved: EUR/USD = 1.0908 / 1.0913
Your actual entry: 1.0913 (NOT 1.0905!)
SLIPPAGE = 1.0913 – 1.0905 = 0.0008 = 8 PIPS
You wanted to buy at 1.0905, but got filled at 1.0913 = 8 pips worse!
Why Does Slippage Happen?
- Execution delay: Quote refreshes every 50-500ms. Price moves between quote and execution
- High volatility: During news, price moves fast. Brokers can’t fill instantly
- Low liquidity: Few buyers/sellers = price gaps up/down when you enter
- Order size: Large orders (5+ lots) = price moves against you to fill
- Gap risk: Market opens with gap (weekend, news) = entry price way off
- Broker delays: Slow execution technology = delayed fills
Slippage Magnitude (Typical):
| Market Condition | Typical Slippage | Example |
|---|---|---|
| Normal trading hours | 0-2 pips | EUR/USD 8:00 AM London time |
| High volatility | 2-10 pips | USD volatility (FOMC, NFP) |
| News events | 5-30+ pips | Fed announcement, economic surprise |
| Market gaps | 50-200+ pips | Weekend gap opening, major news |
| Liquidity crisis | 100-500+ pips | Flash crash, market closure news |
⚠️ Slippage Killer: You scalp, profit 10 pips, but slippage on entry = 5 pips + spread = 5 pips. Net profit = 0. You just wasted time for ZERO profit. This is why slippage destroys scalping profits.
Total Trading Cost: Spread + Slippage + Commission
The Complete Cost Equation:
Total Cost = Spread × 2 + Slippage + Commission
Real Example – Standard Account:
Olympus Standard (1.6 pips fixed, $0 commission)
Entry spread: 1.6 pips
Slippage on entry: 2 pips (normal market)
Exit spread: 1.6 pips
Slippage on exit: 1 pip
Commission: $0
TOTAL COST = 1.6 + 2 + 1.6 + 1 = 6.2 PIPS
Per standard lot (100,000 units): 6.2 × $10 = $62 cost
Real Example – Raw Account:
Olympus Raw (0.0 pips floating, $3.50/lot commission)
Entry spread: 0.2 pips (normal market)
Slippage on entry: 0.5 pips (tight execution)
Exit spread: 0.2 pips
Slippage on exit: 0.3 pips
Commission: $3.50 (per lot) = 0.35 pips
TOTAL COST = 0.2 + 0.5 + 0.2 + 0.3 + 0.35 = 1.55 PIPS
Per standard lot: 1.55 × $10 = $15.50 cost
✅ Raw saves $46.50 per round trip vs Standard!
Annual Cost Comparison (100 trades/year):
| Account Type | Cost/Trade | 100 Trades | 200 Trades | 300 Trades |
|---|---|---|---|---|
| Standard 1.6 | $62 | $6,200 | $12,400 | $18,600 |
| Raw 0.0 | $15.50 | $1,550 | $3,100 | $4,650 |
| SAVINGS | $46.50 | $4,650 | $9,300 | $13,950 |
Raw account saves $4,650-$13,950 per year on 100-300 trades!
💚 Key Insight: Most retail traders ignore costs. They trade 200 times/year on Standard account = $12,400 in costs. Same trader on Raw account = $3,100 costs. The $9,300 difference compounds into THOUSANDS saved annually.
How Slippage Destroys Profitability
Example #1: The Scalper (10 pips profit target)
Goal: Scalp 10 pips per trade, 5 pips stop loss
Risk: $50 (5 pips × $10/pip)
Reward: $100 (10 pips × $10/pip)
Risk/Reward = 1:2 (good!)
REALITY with slippage:
Entry slippage: +3 pips (entry worse)
Spread cost (entry): 1.6 pips
Actual profit achieved: 10 pips
Exit slippage: +1 pip (exit worse)
Spread cost (exit): 1.6 pips
TRUE PROFIT = 10 – 3 – 1.6 – 1 – 1.6 = 2.8 PIPS
TRUE PnL: $28 (NOT $100!)
❌ Wow! 72% of profit eaten by slippage & spread!
Example #2: The Swing Trader (100 pips profit target)
Goal: Swing trade 100 pips, 50 pips stop loss
Risk: $500
Reward: $1,000
Risk/Reward = 1:2 (good!)
REALITY with Raw account:
Entry slippage: +0.5 pips
Spread cost (entry): 0.2 pips
Actual profit achieved: 100 pips
Exit slippage: +0.3 pips
Commission (round trip): 0.7 pips
Spread cost (exit): 0.2 pips
TRUE PROFIT = 100 – 0.5 – 0.2 – 0.3 – 0.7 – 0.2 = 98.1 PIPS
TRUE PnL: $981 (vs $1,000 expected)
✅ Only 1.9% lost to costs (Raw account advantage!)
❌ The Profitability Trap: Traders focus on winning 60% of trades. But they ignore that each trade costs 5-10 pips in spread + slippage. You need bigger wins to overcome costs. That’s why swing trading > scalping for retail traders.
How to Minimize Spread & Slippage Costs
Rule #1: Choose Tight Spreads (Raw Account)
Switch from Standard (1.6 pips) to Raw (0.0 pips floating).
Saves 1.6 pips × 2 = 3.2 pips per round trip.
On 100 trades: 3.2 × 100 × $10 = $3,200 saved annually!
Rule #2: Trade During Liquid Hours
Trade major pairs during peak hours (8:00-17:00 London = 13:00-22:00 New York)
Spreads tightest, slippage lowest
Avoid news events, economic data releases
Rule #3: Avoid News Volatility
Don’t trade during Fed, ECB, NFP announcements.
Slippage spikes to 10-50+ pips during news.
One bad news trade = spread/slippage savings lost for weeks!
Rule #4: Limit Order Size (Scalping)
Large orders (5+ lots) = price gaps to fill you.
Keep scalps to 0.5-1.0 lots max.
Swing trades can be 2-5 lots (wider stops absorb slippage).
Rule #5: Set Realistic Profit Targets
Don’t aim for 5-10 pip scalps (eaten by costs).
Aim for 30-50 pip swings (costs become negligible).
Swing trade > Scalp trade (mathematically proven).
Rule #6: Use Market Orders Wisely
Market Order: Buy/sell NOW. Fills instantly but at market price (higher slippage).
Limit Order: Buy at specific price. Waits for price (zero slippage, but might miss trade).
Use limit orders when possible. Market orders only during trending moves.
Rule #7: Avoid Exotic Pairs
Major pairs (EUR/USD, GBP/USD): 0-1 pips spread
Minor pairs (EUR/GBP): 1-3 pips spread
Exotic pairs (USD/ZAR): 5-20+ pips spread
Stick to majors for tight costs.
Olympus Capital FX Account Spreads & Costs
Standard Account (1:500 Leverage)
| Pair | Spread | Type | Commission | Round Trip Cost |
|---|---|---|---|---|
| EUR/USD | 1.6 pips | Fixed | $0 | 3.2 pips |
| GBP/USD | 1.6 pips | Fixed | $0 | 3.2 pips |
| USD/JPY | 1.6 pips | Fixed | $0 | 3.2 pips |
| Gold (XAUUSD) | 2.5 pips | Fixed | $0 | 5.0 pips |
Raw Account (1:200 Leverage, Tight Spreads)
| Pair | Spread | Type | Commission | Round Trip Cost |
|---|---|---|---|---|
| EUR/USD | 0.0 pips | Floating | $3.50/lot | ~0.7 pips |
| GBP/USD | 0.0 pips | Floating | $3.50/lot | ~0.7 pips |
| USD/JPY | 0.0 pips | Floating | $3.50/lot | ~0.7 pips |
| Gold (XAUUSD) | 0.2 pips | Floating | $3.50/lot | ~0.9 pips |
Pro Account (1:200 Leverage, Best Rates)
| Pair | Spread | Type | Commission | Round Trip Cost |
|---|---|---|---|---|
| EUR/USD | 0.0 pips | Floating | $3/lot | ~0.6 pips |
| GBP/USD | 0.0 pips | Floating | $3/lot | ~0.6 pips |
| Major Pairs | 0.0 pips | Floating | $3/lot | ~0.6 pips |
Account Recommendation:
Beginners: Start Standard (predictable costs)
Active traders (50+ trades/month): Switch to Raw (spreads savings outpace commissions)
Institutions/Elite: Pro account (lowest possible costs)
Spread & Slippage During News Events
⚠️ News Events = Spread Explosion
FOMC Decision (Fed Interest Rate):
- Normal: EUR/USD 1.6 pips (Standard) or 0.1 pips (Raw)
- During announcement: 5-20 pips (even Raw widens!)
- Slippage: 10-50+ pips (order can’t fill at expected price)
NFP (Non-Farm Payroll):
- Normal: 1.6 pips
- During release: 10-30 pips
- Slippage: 20-100+ pips
ECB Meeting Minutes:
- Normal: 1.6 pips
- Surprise decision: 20-50+ pips
- Slippage: 30-150+ pips
❌ Why NOT to Trade News:
You’re trying to scalp 10 pips. News event hits = spread widens to 20 pips. Your entire profit target is GONE before you enter. One news trade = wipes out 5-10 days of profitable scalping.
💚 Golden Rule: Don’t trade 1 hour before or after major economic data. Spread risk >>> profit potential.
🎯 Key Takeaways: Spreads & Slippage Mastery
- Bid-Ask spread = broker’s profit, your cost: Buy at ASK (higher), sell at BID (lower). Spread = difference.
- Spread costs you TWICE per trade: Entry spread + exit spread. A 1.6 pip spread = 3.2 pips total cost.
- Fixed spreads (1.6) vs floating (0.0): Floating cheaper during normal hours (0.1-0.3 pips) but widens during volatility.
- Slippage = execution delay cost: Price moves between your order + broker’s execution. Can be 0-100+ pips depending on volatility.
- Slippage destroys scalping: 10 pip scalp target + 3 pips slippage + 3.2 pips spread = only 3.8 pips actual profit. 62% lost!
- Total cost formula: Spread × 2 + Slippage + Commission = real cost per trade.
- Raw account saves $4,650+ annually: Vs Standard account on 100+ trades/year.
- News events = avoid: Spreads widen 10-50x, slippage 20-100+ pips. Not worth the risk.
- Trade major pairs during liquid hours: EUR/USD, GBP/USD, USD/JPY = tightest spreads, lowest slippage.
- Use limit orders, not market orders: Limit = zero slippage. Market = instant fill but worse price.
- Swing trade > Scalp trade: 100 pip swing = costs negligible. 10 pip scalp = costs eat profit.
- Exotic pairs = wide spreads: USD/ZAR 5-20+ pips spread. Majors only for cost efficiency.
- Olympus Standard = 3.2 pips per round trip. Olympus Raw = 0.7 pips per round trip.
- Slippage increases with order size: 0.1 lots = minimal slippage. 5+ lots = price gaps to fill.
- You need to profit 6.2+ pips just to break even: On Standard account (before any profit!). This is reality.
