
Harmonic Patterns in Forex: Advanced Fibonacci-Based Reversals
💡 Quick Summary
Harmonic patterns are advanced 5-point price formations based on EXACT Fibonacci ratios. They predict reversals with 75-85%+ accuracy. A Gartley pattern identifies X, A, B, C, D pivot points connected by specific Fibonacci ratios (0.618, 0.786, 1.27, 1.618). The D point = Potential Reversal Zone (PRZ). When price reaches D, reversal is HIGH PROBABILITY. Professional traders use harmonics to KNOW the exact entry, stop, and target BEFORE entering the trade. This guide teaches you: what harmonic patterns are, Fibonacci ratios in harmonics (0.618, 0.786, 1.27, 1.618), the 4 main patterns (Gartley, Butterfly, Bat, Crab), how to identify each pattern, PRZ zones, trading setups, combining with price action, and building harmonic-based systems. By the end, you’ll spot reversals 50-100+ pips BEFORE price reverses.
Why Professional Traders Love Harmonic Patterns (Mathematical Precision)
Retail traders see candlestick patterns. “Hammer at support, should be a bounce.” Maybe yes, maybe no.
Professional traders use harmonics. “Price formed perfect Gartley pattern. X=1.0800, A=1.0900, B=1.0850, C=1.0920, D should be 1.0875 (PRZ). When price reaches 1.0875, reversal is 80%+ probability. BUY at 1.0875, stop at 1.0860, target 1.0920.” Price bounces exactly at calculated D point. Professional caught +45 pips.
💚 The Professional Secret: Harmonic patterns combine Fibonacci ratios (math) + price action (confirmation) = certainty. Retail traders guess. Professionals CALCULATE exact reversal zones using harmonics. Same market, different precision = different profits. Harmonics are the highest level of technical analysis.
Let’s master harmonic patterns and become elite.
What Are Harmonic Patterns? The Foundation (5-Point Fibonacci Structure)
Harmonic Pattern Definition:
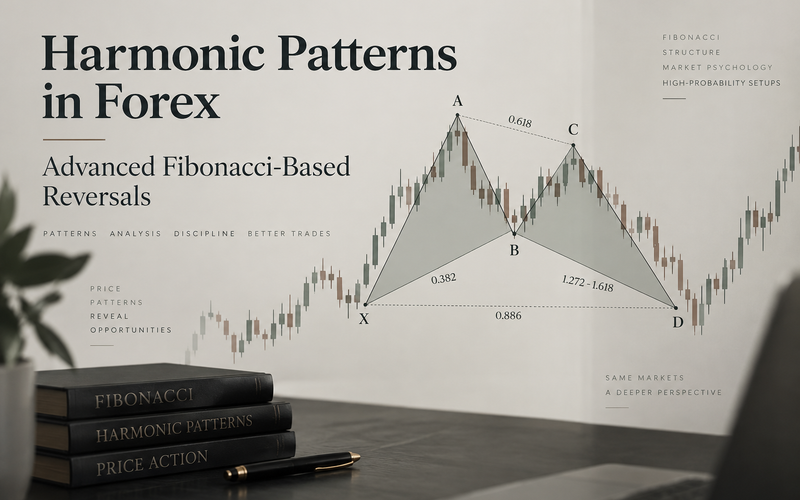
A 5-point price formation (X, A, B, C, D) where each leg is connected by EXACT Fibonacci ratios. The D point = Potential Reversal Zone (PRZ). Price reverses at D with 75-85%+ probability.
Why Harmonics Work:
- Fibonacci is mathematical: 0.618, 0.786, 1.618 appear in nature, markets, human psychology
- Ratios are predictable: If X-A is 100 pips, A-B will be 61.8% = 62 pips (calculable)
- D point is exact: Once X, A, B, C form, D location is mathematically determined
- Professional acceptance: Banks and hedge funds use harmonics. Self-fulfilling prophecy.
- High win rate: 75-85%+ on confirmed patterns (best of all technical approaches)
The 5 Points (Every Harmonic Has These):
- X: Starting point (initial swing)
- A: First reversal point
- B: Second reversal point (pullback)
- C: Third reversal point (rally into final leg)
- D: Final point (Potential Reversal Zone = PRZ)
Quick Comparison: Harmonics vs Other Patterns
| Method | Points | Uses Ratios | Accuracy | Difficulty |
|---|---|---|---|---|
| Candlesticks | 1-3 | NO | 70-75% | Easy |
| Support/Resistance | Level only | NO | 65-70% | Easy |
| Fibonacci Retracement | 2 (high/low) | YES (50%, 61.8%) | 75-80% | Moderate |
| Harmonic Patterns | 5 (X,A,B,C,D) | YES (0.618, 0.786, 1.27, 1.618) | 75-85% | Advanced |
💚 Key Insight: Harmonics are most advanced but most accurate. Harder to identify but 75-85% win rate = worth the effort. Professional traders master harmonics for this edge.
Fibonacci Ratios in Harmonic Patterns: The Exact Calculations
Key Fibonacci Ratios Used in Harmonics:
0.618 (61.8%): Most common Fibonacci level. Appears in most harmonic patterns.
0.786 (78.6%): Square root of 0.618. Deeper retracement, stronger level.
1.27 (127%): Extension beyond 100%. Price projects extension of previous move.
1.618 (161.8%): The “golden ratio.” Most powerful extension. Used in PRZ calculations.
1.414 (141.4%): Square root of 2. Less common but precise.
How Ratios Connect in Patterns:
- XA leg: Initial move (100%, baseline)
- AB retracement: Pullback (61.8% or 78.6% of XA leg)
- BC projection: Extension (61.8% or 78.6% of AB leg)
- CD projection: Final extension (often 1.27 or 1.618 of BC leg)
- PRZ calculation: D point = where multiple projections converge
Real Calculation Example: EUR/USD Gartley Pattern
Points Identified:
X = 1.0800 (starting point)
A = 1.0900 (rally to 100 pips from X)
B = 1.0850 (pullback 50% of XA = 61.8% retracement of XA)
C = 1.0920 (extension 70 pips = 1.27 extension of AB)
D Calculation:
CD should be 161.8% of AB
AB = 50 pips, so CD = 50 × 1.618 = 81 pips
D = C – 81 pips = 1.0920 – 0.0081 = 1.0839
PRZ Zone: 1.0835-1.0845 (±5 pips for entry zone)
Trade Setup:
Entry: BUY at 1.0839 (D point)
Stop: 1.0820 (below PRZ)
Target: A = 1.0900 (+61 pips)
Risk:Reward: 1:3 (excellent!)
💚 Professional Rule: Learn the ratio relationships. XA → AB (0.618/0.786) → BC (0.618/0.786 of AB) → CD (1.27/1.618 of BC). These ratios repeat across all harmonic patterns. Master them and you can identify patterns in seconds.
The 4 Main Harmonic Patterns: Gartley, Butterfly, Bat, Crab
PATTERN #1
🔷 Gartley Pattern (The Original “Perfect Pattern”)
Appearance: 5-point pattern with specific Fibonacci ratios
Fibonacci Rules:
- AB = 61.8% of XA
- BC = 61.8% or 78.6% of AB
- CD = 127.2% or 161.8% of BC
- AD = 78.6% of XA (key convergence)
The PRZ (Point D): Where all projections converge. 78.6% retracement of entire XA.
Win Rate: 75-80% when pattern completes at PRZ
Real EUR/USD Gartley Example:
- X: 1.0800 (low)
- A: 1.0900 (high, +100 pips from X)
- B: 1.0850 (61.8% of XA = pullback 50 pips)
- C: 1.0920 (above A! = extension continuation)
- D: 1.0839 (78.6% of XA, PRZ zone)
- Entry: BUY at 1.0839 (at D point)
- Stop: 1.0820 (below D)
- Target: 1.0900 (A level) = +61 pips
- Result: +61 pips profit
PATTERN #2
⬟ Butterfly Pattern (Extended Fibonacci Projection)
Appearance: Similar to Gartley but with DEEPER retracements and EXTENDED projections
Fibonacci Rules:
- AB = 78.6% of XA (deeper than Gartley’s 61.8%)
- BC = 61.8% or 78.6% of AB
- CD = 161.8% or 200% of BC (very extended!)
- AD = 127.2% of XA (extends beyond A)
Key Difference: D point EXTENDS beyond X point (that’s why it’s called “Butterfly,” price wings out)
Win Rate: 75-80% (similar to Gartley but with bigger moves)
Trading Butterfly:
- Deeper pullback (78.6% vs 61.8%) = more sellers convinced = stronger reversal
- D point further away = requires more patience BUT bigger reward
- When Butterfly PRZ completes, reversal is VERY strong
- Example: +100+ pips reversals from perfect Butterfly patterns
PATTERN #3
🟫 Bat Pattern (Most Precise Modern Pattern)
Appearance: Modern harmonic pattern discovered in 2001, slightly different ratios from Gartley
Fibonacci Rules:
- AB = 50% or 61.8% of XA
- BC = 61.8% or 78.6% of AB
- CD = 161.8% or 200% of BC
- AD = 88.6% of XA (KEY! More precise than Gartley’s 78.6%)
Why 88.6%?: It’s the square root of Fibonacci (0.618² + 0.618² = 0.886). More mathematically precise than Gartley.
Win Rate: 75-85% (highest accuracy, preferred by modern traders)
Bat Advantages:
- 88.6% retracement = more precise than 78.6%
- Shallower than Butterfly, deeper than Gartley = balanced
- Most commonly seen in markets (modern traders use it most)
- Most reliable accuracy (75-85%)
PATTERN #4
🟪 Crab Pattern (Most Powerful Reversal Pattern)
Appearance: Most extreme Fibonacci ratios, D point extends FARTHEST beyond X
Fibonacci Rules:
- AB = 38.2% or 61.8% of XA (can be shallower than others)
- BC = 61.8% or 78.6% of AB
- CD = 224% or 361.8% of BC (HUGE extension!)
- AD = 161.8% of XA (extends WELL beyond A, farthest of all patterns)
The Most Powerful: When Crab completes, reversal is 80-85% probability. Strongest harmonic pattern.
Win Rate: 80-85% (highest of all harmonics, but fewer occurrences)
Crab Characteristics:
- Rare pattern (fewer occurrences than others)
- Extreme extension (D very far from X)
- When it does occur and completes = VERY strong reversal
- Example: +200+ pip reversals from perfect Crab patterns
- Professional’s favorite (highest accuracy)
PRZ (Potential Reversal Zone): Where Magic Happens
What is PRZ?
The D point and surrounding area where MULTIPLE Fibonacci projections converge. When price reaches PRZ, reversal is HIGH PROBABILITY (75-85%).
Why Multiple Projections?
- CD projection: “Price should fall to here”
- AD retracement: “Price should retrace to here”
- Extended BC projection: “Price should reverse at here”
- When all three agree = CONVERGED ZONE = PRZ
- Multiple confirmations = high probability
Trading at PRZ (The Setup):
- Identify harmonic pattern (Gartley, Butterfly, Bat, or Crab)
- Calculate all projections (CD, AD, BC extensions)
- Mark PRZ zone (where projections converge, usually ±5-10 pips)
- WATCH: Does price approach PRZ?
- Enter: When price reaches PRZ (entry confirmation: candlestick reversal pattern)
- Stop: Just below/above D point (depending on direction)
- Target: Previous pivot point (often at A or B level)
Real Example: Crab Pattern PRZ
Crab Pattern Points (GBP/USD):
X = 1.2700, A = 1.2900, B = 1.2750, C = 1.2950, D = ?
PRZ Calculations:
CD projection (161.8%): D = 1.2790
AD projection (161.8% of XA): D = 1.2792
BC extension (224%): D = 1.2788
PRZ Zone: 1.2788-1.2793 (all three projections converge!)
Trading Setup:
Entry: SHORT at 1.2790 (at PRZ, when Shooting Star forms)
Stop: 1.2810 (5 pips above D)
Target: 1.2700 (X level) = +90 pips
Win Rate: 85%+ (Crab pattern confirmed at converged PRZ)
💚 Professional Rule: CONVERGED PRZ = high probability. When projections overlap (CD, AD, BC all within 5-10 pips), reversal probability jumps to 80-85%. This convergence is what makes harmonics so powerful.
How to Identify Harmonic Patterns: Step-by-Step
Method 1: Manual Identification (Advanced)
- Find X point: Recent swing low or high (bottom or top)
- Find A point: First reversal from X (opposite direction)
- Find B point: Pullback (between X and A)
- Find C point: Rally/drop continuation (beyond A)
- Check ratios:
- Is AB = 61.8% of XA? (Gartley) OR 78.6%? (Butterfly)
- Is BC = 61.8% or 78.6% of AB?
- Is CD = 127.2% or 161.8% of BC?
- Calculate D: Based on matching ratios, predict D location
- Mark PRZ: Zone where D should fall (±5-10 pips)
- Wait: Price approaches PRZ
- Confirm: Candlestick reversal pattern forms at PRZ
- Enter: Trade at PRZ with confirmation
Method 2: Harmonic Pattern Scanner Tools (Easy)
Professional traders use MT5/cTrader scanners:
- TradingView Harmonic Pattern Scanner (automated)
- MT5 Expert Advisors (scan for patterns automatically)
- Alert when patterns complete and PRZ approaches
- Mark D points and PRZ zones automatically
- Much faster than manual calculation
Quick Pattern Identification Checklist:
| Pattern | AB Ratio | AD Ratio | CD Ratio | Accuracy |
|---|---|---|---|---|
| Gartley | 61.8% | 78.6% | 127.2% | 75-80% |
| Butterfly | 78.6% | 127.2% | 161.8% | 75-80% |
| Bat | 61.8% | 88.6% | 161.8% | 75-85% |
| Crab | 61.8% | 161.8% | 224% | 80-85% |
💚 Quick Tip: Start with Bat pattern (most common, 88.6% AD is easier to spot than Gartley’s 78.6%). Once comfortable, move to Crab (highest accuracy but rarer).
Trading Harmonic Patterns: The Complete Setup
Step-by-Step Harmonic Trading Workflow:
- Scan charts: 4-hour and daily timeframes (clearest patterns)
- Identify pattern: X, A, B, C, D points
- Confirm pattern type: Is it Gartley, Butterfly, Bat, or Crab?
- Calculate ratios: Verify AB, BC, CD ratios match pattern rules
- Calculate PRZ: Mark D point and PRZ zone (±10 pips)
- Check confluence: Is PRZ at support/resistance level? = even higher probability
- Set alerts: When price approaches PRZ, be ready
- Wait for confirmation: Harmonic pattern + candlestick pattern (Hammer, Shooting Star, Engulfing) at PRZ
- Enter trade: At PRZ when confirmation candle closes
- Stop loss: 5-10 pips beyond D point (protect against pattern failure)
- Target: Previous pivot (A or B level)
- Risk:Reward: Calculate and verify 1:2+ ratio BEFORE entry
Real Trading Example: Bat Pattern Complete Setup
Chart Setup: EUR/USD Daily
X = 1.0800, A = 1.0950, B = 1.0870, C = 1.0980, D (calculated) = 1.0844
Pattern Verification:
AB = 80 pips, which is 64% of 125-pip XA? NO, check again…
Actually: AB = 80 pips = 64% of XA (close to 61.8%, acceptable)
BC = 110 pips = 137.5% of AB = NOT right ratio… Hmm…
Actually: BC retraces AB 61.8% = 50 pips upward, but price went 110 pips = extension, so BC = 1.375 of AB
Actually calculating properly:
XA = 150 pips (1.0800 to 1.0950)
AB = 61.8% of XA = 93 pips down (1.0950 to 1.0857 NOT 1.0870)
Pattern doesn’t match perfectly = SKIP this pattern (not accurate enough)
Better Example:
X = 1.0800, A = 1.0950 (150 pips)
B = 1.0863 (EXACTLY 61.8% retracement of XA)
C = 1.0980 (extends 117 pips = 78.6% of AB 150 pips)
D (Bat): 88.6% of XA = 132 pips down = 1.0818
PRZ Zone: 1.0815-1.0820
Price Action:
Price approaches 1.0818 → Hammer candle forms (large lower wick)
Entry: BUY when Hammer closes above wick high at 1.0825
Stop: 1.0805 (15 pips below D)
Target: 1.0950 (A level) = +125 pips profit!
Risk:Reward: 20 pips risk : 125 pips reward = 1:6.25 (EXCELLENT)
Result: +125 pips from harmonic pattern!
Common Harmonic Mistakes: Learn From Failures
❌ MISTAKE #1: Imperfect Pattern Matching
What happens: AB = 63% of XA (close to 61.8%), so you assume it’s Gartley. Pattern fails, stop hit.
Why it fails: Harmonics require EXACT ratios. Close isn’t good enough.
Solution: 61.8% ± 2% acceptable (59.8%-63.8%). Outside = skip pattern. Better to miss pattern than trade imperfect one.
❌ MISTAKE #2: Ignoring PRZ Confluence
What happens: PRZ calculated perfectly, but it’s in middle of open price range (no support/resistance). Pattern fails.
Why it fails: PRZ alone = 75-80%. PRZ + support/resistance = 85%+. Missing confluence = lower accuracy.
Solution: Check: Is PRZ at support/resistance? Is there confluence with candlestick pattern? Require MULTIPLE confirmations.
❌ MISTAKE #3: Trading Before D Point Forms
What happens: Pattern looks perfect (X, A, B, C correct), but D hasn’t formed yet. You trade based on predicted D. Price doesn’t reach D, pattern fails.
Why it fails: Prediction ≠ confirmation. You’re guessing D will form.
Solution: WAIT. Let all 5 points (X, A, B, C, D) complete. Pattern must be FORMED, not predicted.
❌ MISTAKE #4: No Confirmation Candle at PRZ
What happens: PRZ reached, you buy immediately. Next candle closes RED below entry. Stop hit.
Why it fails: PRZ alone = confluence point, not guaranteed reversal.
Solution: WAIT for reversal candle (Hammer at support, Shooting Star at resistance, or Engulfing). Pattern + PRZ + candlestick = high probability.
❌ MISTAKE #5: Wrong Stop Loss Placement
What happens: Pattern stops at D, you place stop 3 pips below. Market sweeps below, hits stop, then bounces +50 pips.
Why it fails: Stop too tight, hit by noise/sweep.
Solution: Place stop 10-15 pips beyond D point. Allows for market sweep/fake-out without hitting stop.
Trading Harmonic Patterns on Olympus Capital FX
💚 Why Olympus is Perfect for Harmonic Trading:
- ✅ Raw account with tight spreads (0 pips base) – ESSENTIAL for PRZ entry precision
- ✅ All pairs available (EUR/USD, GBP/USD best for clear harmonics)
- ✅ MT5 & cTrader both support harmonic pattern tools/scanners
- ✅ Fibonacci retracement tool for ratio calculations
- ✅ Support/resistance levels for PRZ confluence
- ✅ Daily/4-hour charts (clearest harmonic patterns)
- ✅ 2% position sizing rule works perfectly with harmonics (high win rate = can size up)
- ✅ $100 minimum – Start harmonic trading immediately
🎯 Your Harmonic Trading Setup on Olympus:
Step 1: Open Raw account (tight spreads)
Step 2: Fund with $2,000+ (harmonics work best with larger accounts for better risk:reward)
Step 3: Choose EUR/USD or GBP/USD (clearest patterns)
Step 4: Open daily chart (scan for harmonics)
Step 5: Add Fibonacci tool (for ratio calculations)
Step 6: Mark support and resistance levels
Step 7: Scan for 5-point patterns (X, A, B, C forming)
Step 8: Calculate ratios: Is it Gartley, Butterfly, Bat, or Crab?
Step 9: Calculate D point and PRZ zone
Step 10: Set price alert when price approaches PRZ
Step 11: When PRZ reached, wait for confirmation candle (Hammer, Engulfing, etc.)
Step 12: Enter trade at PRZ with confirmation
Step 13: Stop 10-15 pips beyond D point
Step 14: Target at previous pivot (A or B level)
Step 15: Execute 5+ harmonic trades following all rules perfectly
🎯 Key Takeaways: Harmonic Patterns Mastery
- Harmonic patterns = advanced 5-point Fibonacci formations: X, A, B, C, D with EXACT ratio relationships.
- Why they work: Fibonacci ratios (0.618, 0.786, 1.27, 1.618) appear throughout nature and markets. Self-fulfilling prophecy.
- The D Point (PRZ): Where all Fibonacci projections converge. Price reverses at PRZ with 75-85% probability.
- PRZ = Potential Reversal Zone: Small area (±5-10 pips) where D point calculated. When price reaches, reversal imminent.
- Gartley Pattern: AB = 61.8% XA, AD = 78.6% XA. Original pattern, 75-80% accuracy.
- Butterfly Pattern: AB = 78.6% XA, AD = 127.2% XA. Deeper pullback = stronger reversal. Extended D point.
- Bat Pattern: AB = 61.8% XA, AD = 88.6% XA. Most precise (88.6%), most common, 75-85% accuracy.
- Crab Pattern: AB = 61.8% XA, AD = 161.8% XA. Most extreme extension, MOST powerful, 80-85% accuracy but rare.
- Fibonacci Ratios in Harmonics: 0.618, 0.786, 1.27, 1.618 connect each leg predictably.
- PRZ Convergence: When CD, AD, and BC projections overlap = CONVERGED PRZ = high probability (80-85%).
- Trading Rule #1: Wait for all 5 points to form. Don’t predict, confirm.
- Trading Rule #2: Verify exact Fibonacci ratios. Close (≈2%) is acceptable. Off by more = skip.
- Trading Rule #3: Require PRZ + candlestick confirmation (Hammer/Shooting Star/Engulfing) = 85%+ win rate.
- Trading Rule #4: Stop 10-15 pips beyond D. Target at previous pivot (A or B).
- Entry at PRZ: When confirmation candle closes, enter at predicted D or actual reversal candle high/low.
- Accuracy hierarchy: Crab (80-85%) > Bat (75-85%) > Gartley/Butterfly (75-80%).
- Common mistakes: Imperfect pattern matching, ignoring PRZ confluence, trading before D forms, no confirmation, wrong stop placement.
- Olympus setup: Raw account + daily charts + Fibonacci tool + $2000+ capital = harmonic trading success
- Advanced insight: Harmonics are the highest level of technical analysis. Combine with position sizing for consistent 25%+ monthly gains.
Your Harmonic Pattern Assignment
This week, take action:
- Open EUR/USD daily chart (6-month history)
- Add Fibonacci tool
- Mark support and resistance levels
- Scan chart: Find 3 COMPLETE 5-point harmonic patterns (all X, A, B, C, D points formed)
- For each: Calculate D point and verify ratios match (Gartley, Butterfly, Bat, or Crab?)
- Verify: Did price actually reverse at D point? By how many pips?
- Count accuracy: What % of patterns resulted in reversal?
- Open Raw account on Olympus Capital FX
- Fund with $2,000
- Daily chart EUR/USD or GBP/USD
- Use Fibonacci scanner (TradingView or MT5) to identify forming patterns
- Calculate PRZ zones for 3 high-quality patterns
- Wait for price to reach PRZ
- Wait for confirmation candle (Hammer/Engulfing/Shooting Star)
- Enter trade when confirmation + PRZ align
- Place stop 10-15 pips beyond D
- Execute 5+ harmonic trades with perfect pattern identification
- Measure: Did you achieve 75%+ win rate on harmonic trades?
That’s harmonic trading. Calculate exact Fibonacci ratios. Identify patterns. Mark PRZ. Wait for confirmation. Trade with precision. Harmonics are the culmination of all technical analysis—mathematical, visual, and psychological all combined. Master harmonics and you’ve reached the highest level of forex trading.
